
Data Analytics
Transform raw data into actionable insights with powerful analytics and visualization tools
Turning data into decisions
We transform complex business data into clear, actionable insights that drive smarter decisions. Our data analytics services help you make sense of the numbers through curated data pipelines that organize and clean your information, interactive dashboards that visualize trends in real-time, and comprehensive reports that tell the story behind your data. Using industry-leading tools and proven methodologies, we turn raw data from multiple sources into a single source of truth for your business. Whether you need to track sales performance, understand customer behaviour, monitor operational efficiency, or measure marketing effectiveness, we build analytics solutions that give you the clarity you need to act with confidence. Our approach focuses on practical insights you can use immediately, not just pretty charts that sit unused.
How we make it work for you
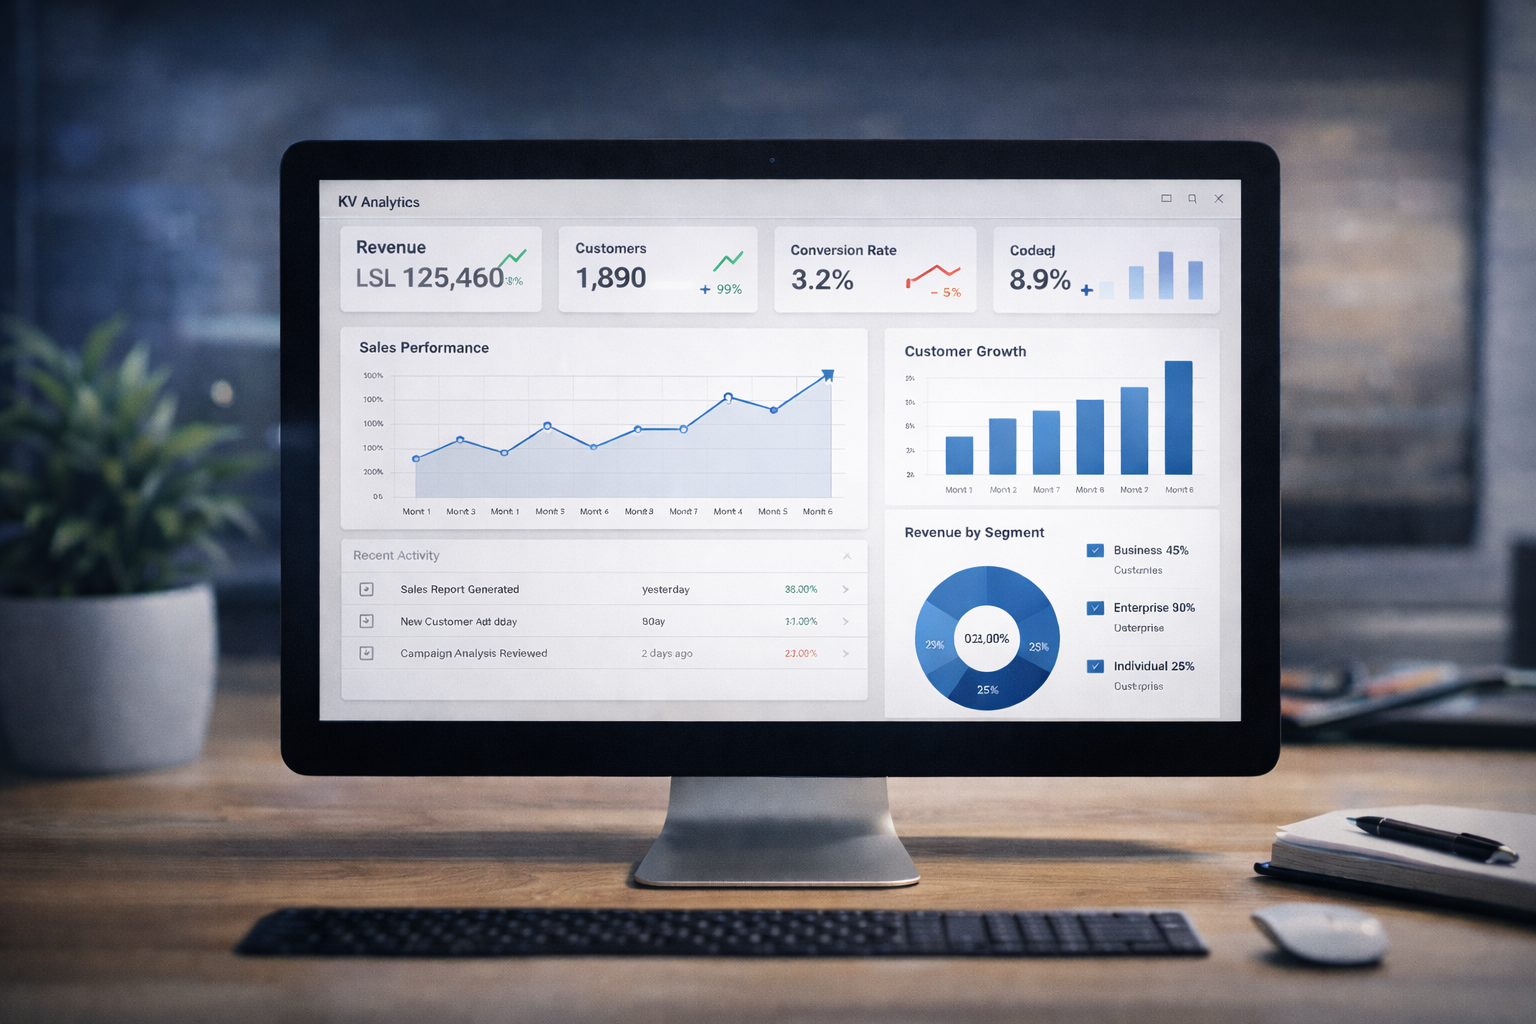
Clear Visual Dashboards
We design interactive dashboards that present your key business metrics in ways that are easy to understand at a glance. These dashboards update automatically with your latest data, so you always have current information to guide your decisions without waiting for manual reports or digging through spreadsheets.
Automated Reporting That Saves Time
Instead of spending hours compiling data from different sources, our automated reporting systems deliver regular updates directly to your inbox or dashboard. We customize these reports to focus on the metrics that matter most to your business, ensuring you spend time acting on insights rather than creating reports.
Data Pipelines That Keep Things Organized
We build reliable data pipelines that collect information from your various business systems and organize it into a structured format ready for analysis. This eliminates the manual work of copying data between systems and ensures your analytics are based on accurate, up-to-date information.
Insights That Match Your Business Context
Our analytics solutions are built around your specific business goals and challenges, not generic templates. We take time to understand what questions you need answered and design our analytics to provide those answers in the context of your industry and market.
Use Cases
Sales Performance Dashboard
We create dashboards that track your sales metrics in real-time, showing which products are selling, which sales channels are performing best, and how your team is tracking against targets. These visual tools help you spot trends quickly and adjust your strategy before small issues become bigger problems.
Customer Behaviour Analysis
Our analytics solutions help you understand how customers interact with your business by tracking their purchase patterns, preferences, and engagement across different touchpoints. This insight enables you to personalize your approach and focus resources on the customers most likely to buy.
Inventory and Stock Reporting
We build reporting systems that monitor your inventory levels, track product movement, and alert you when stock is running low or moving slowly. This helps you optimize your inventory investment and avoid both stockouts that lose sales and excess inventory that ties up cash.
Financial Performance Reports
Our automated financial reporting pulls data from your accounting systems to create clear summaries of revenue, expenses, and profitability across different products, services, or business units. These reports give you the financial clarity needed for strategic planning and investor updates.
Marketing Campaign Analytics
We develop analytics that measure the effectiveness of your marketing efforts by tracking customer acquisition costs, conversion rates, and return on investment for different campaigns. This helps you allocate your marketing budget to the channels and messages that actually drive results.
Operational Efficiency Monitoring
Our dashboards track key operational metrics like service delivery times, resource utilization, and process bottlenecks to help you identify opportunities for improvement. By visualizing your operations data, you can quickly see where efficiency gains are possible and measure the impact of process changes.